Context Graphs Aren’t Theory: How We Use Them in Real Client Implementations

Recent Jaya Gupta 's writing on context graphs has surfaced an important question: where does real enterprise AI value actually come from?
The emerging answer is that it won’t come from layering AI on top of systems of record, but from capturing the decision context that connects data to action.
For us at Beacon, this wasn’t a thesis we set out to prove. Context graphs emerged as a by-product of running AI agents in production—first across workflows and support, and later across full enterprise implementations.
The moment we treated AI as part of the execution layer, not a SaaS copilot. The architecture became obvious: execution must produce memory, and memory must be contextual.
We didn’t start by building a “context graph platform.” We started by treating AI as part of the execution layer. Once you do that, a few things follow naturally:
Execution produces trajectories
Trajectories carry context
Systems only improve if that context is persisted and reused
Context graphs weren’t a product decision. They were the natural outcome of execution-first AI.
This post is a walkthrough of how that architecture emerged, and why it became unavoidable once we moved beyond bounded automation into real enterprise implementations.
The Failure Mode: Missing Context, Not Missing Steps
As we moved into full implementations, execution stopped being the problem. The bottleneck was context.
Critical decisions lived in Slack threads, calls, and escalations, then disappeared. Every implementation restarted from scratch.
At that point, automation wasn’t the constraint. Institutional memory was.
Implementations don’t fail because systems don’t know what exists, they fail because systems don’t know what mattered in a specific context.
The Architectural Shift: From State to Event Memory
This is where the “two clocks” distinction, introduced by Animesh Koratana of PlayerZero became unavoidable.
Enterprise systems are built around the state clock: > What is true right now?
Implementations run on the event clock: > What happened, in what order, and why?
Our orchestration system already had access to the event clock because agents were executing work in real time. The missing piece was persisting that event-level reasoning as a first-class artifact.
This is where context graphs entered the picture.
What a Context Graph Means in Beacon
In Beacon, a context graph is not:
A static DAG
A documentation layer
A manually curated ontology
It is a learned, evolving representation of execution context, constructed from agent trajectories.
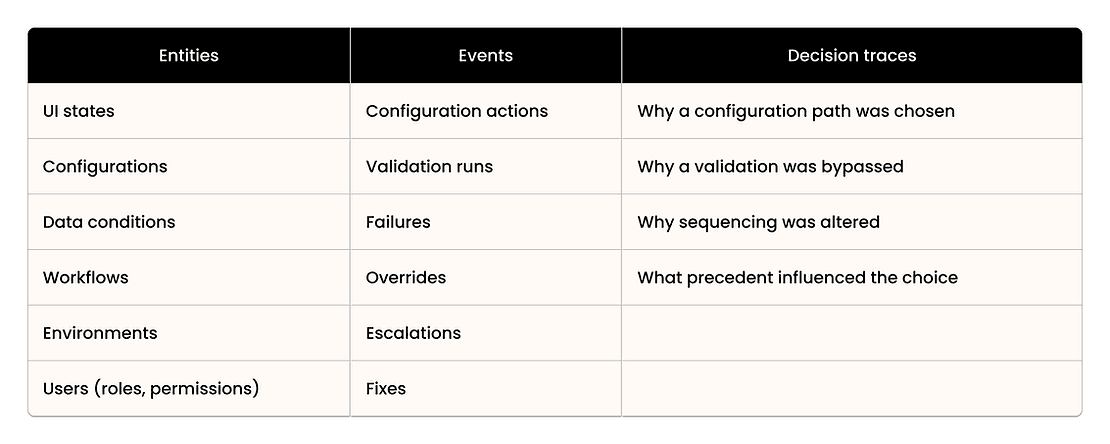
Core primitives we persist:
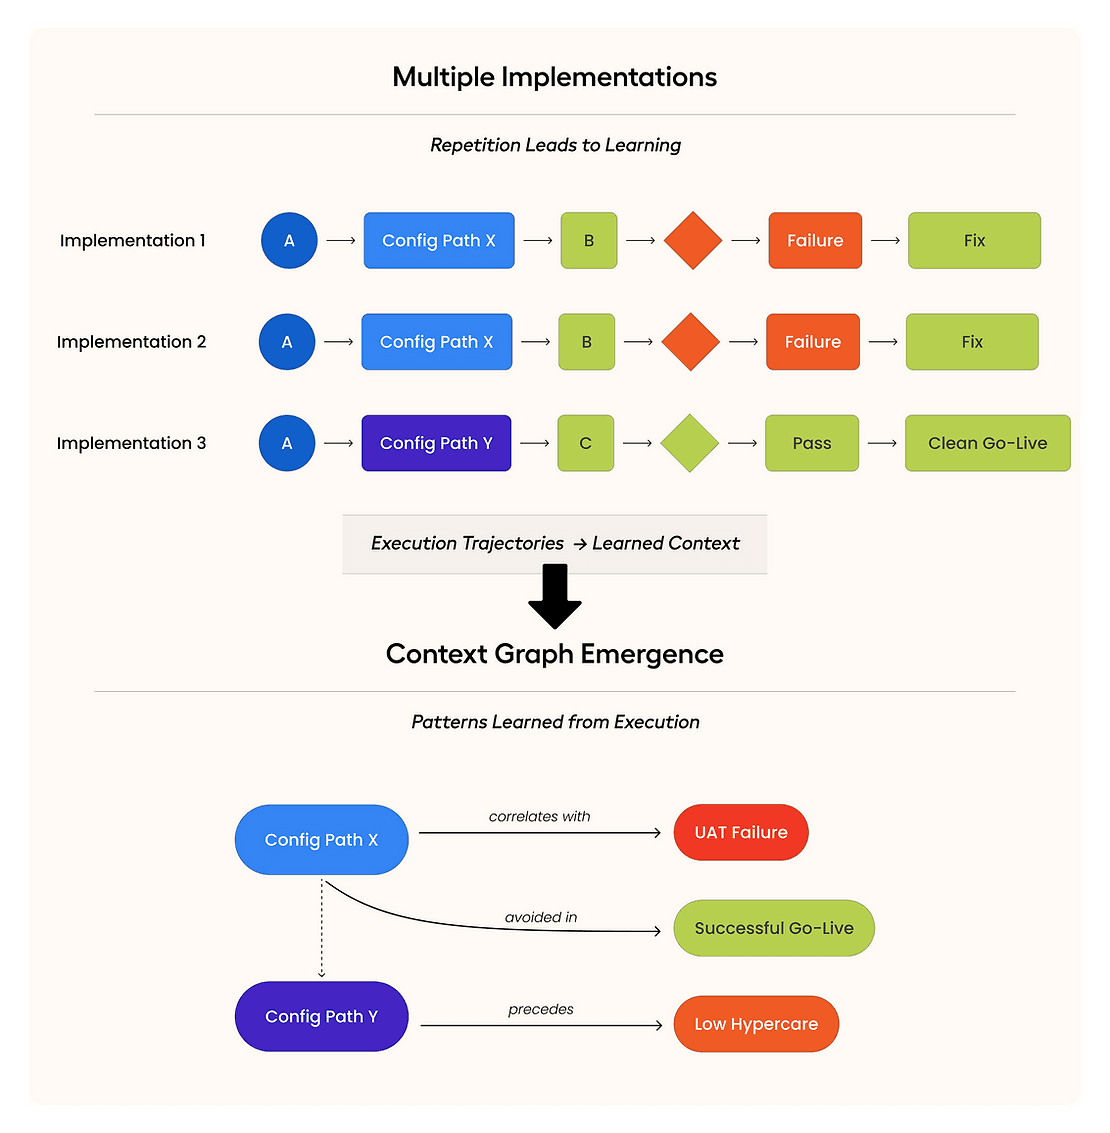
Each implementation produces a trajectory of decisions and outcomes. Over time, these trajectories overlap and cluster.
Traditional enterprise systems record state.
For example: Auto-sync: Disabled
That tells you what’s true, not how you got there or why.
In Beacon, we capture:
What exists: auto-sync is disabled
What happened: the setting was changed during implementation
Why it happened: to resolve a data validation conflict caused by concurrent writes from a legacy system
That “why” usually lives in Slack threads or in someone’s head. Once the project ends, it’s lost.
In Beacon, that reasoning becomes system memory. Each decision is recorded as a trace linked to the configuration, data condition, implementation phase, and downstream outcome.
Across implementations, these traces repeat and connect. The structure isn’t predefined. It emerges from real execution.
That accumulated graph of decisions, context, and outcomes is what we call the context graph.
Context Graphs Across the Implementation Lifecycle
1. Configuration Phase
During configuration, agents don’t simply apply settings. They record:
Option selections
Dependency activations
Constraint violations
Manual overrides
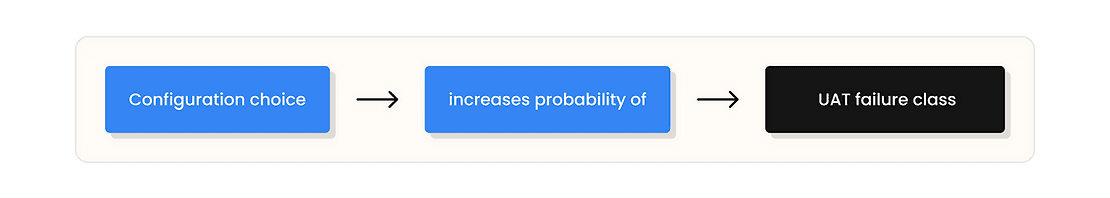
These decisions become nodes and edges in the context graph:
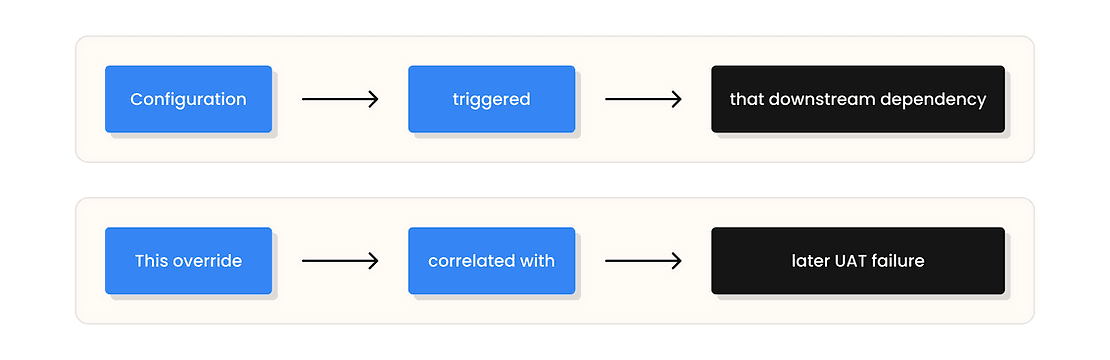
Over time, the system learns which configuration subgraphs are stable and which are fragile.
2. UAT Phase
Most UAT failures aren’t new defects. They’re downstream effects of earlier decisions.
In Beacon, UAT works like this:
Agents generate UAT flows from the live configuration, data, and real workflow paths
When a test fails, it’s traced back to the configuration or sequencing decision that caused it
The system determines whether the behavior is expected under this implementation context
For example:
Payroll sync is intentionally disabled during migration
A payroll mismatch appears in UAT
The system recognizes this as an expected outcome, not a blocker
That result is recorded and linked to:
The original configuration override
The migration phase
Post–go-live outcomes
When a future HRMS implementation hits the same constraint,
It can surface:
In previous implementations, disabling payroll sync during migration avoided data corruption but caused predictable UAT payroll mismatches that resolved post–cutover.
This creates cross-phase edges in the context graph:
3. Hypercare Phase
Hypercare is where context graphs prove their value.
Post–go-live issues almost always trace back to earlier decisions. Our agents resolve a large percentage autonomously. But more importantly, record causal chains
This creates feedback loops:
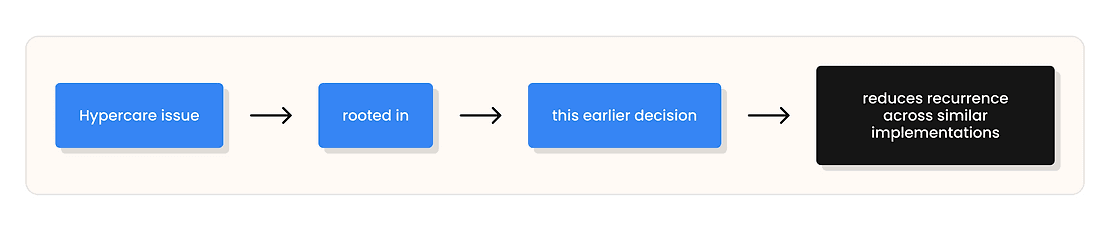
Across implementations, this collapses hypercare duration dramatically. In practice, we’ve seen ~60% average reduction in end-to-end timelines, primarily because fewer unknowns reach production.
Why This Only Works with Agents in the Execution Path
Warehouses see data after the fact. CRMs see current state. Logs see events without meaning.
Context graphs require being in the execution path at commit time.
Our agents:
See inputs across systems
Evaluate conditions
Take actions
Observe outcomes
This is why the graph can encode why, not just what.
Industry Generalization Without Resetting
We’ve deployed this architecture across HRMS, Logistics, Insurtech, Retail and Enterprise SaaS
For example:
In a CRM implementation, an opportunity close date validation might fail because the fiscal calendar wasn’t configured before pipeline rules were activated.
In an HRMS implementation, payroll calculations might be blocked because benefits eligibility rules weren’t defined before employee data was imported.
The domains are different. The symptoms look unrelated. But the pattern is identical: a downstream failure caused by an earlier sequencing decision.
We don’t start from zero per industry. We start with accumulated execution intelligence.
What We’re Building Toward
The long-term value isn’t faster implementations alone.
It’s a system where:
Every implementation teaches the platform
Every exception becomes searchable precedent
Every decision strengthens future autonomy
Context graphs turn implementations from cost centers into compounding assets.
So when people ask whether context graphs are real, or whether enterprises are “ready” for them, our answer is straightforward: If you’re orchestrating real work with agents, you’ll be forced to build them. If you’re not, they’ll remain a thought experiment.
To be candid, some problems remain hard across the industry:
Partial observability of legacy systems
Identity resolution across tools
Causal inference vs correlation at scale
Human-legible explanations over dense graphs
Closing
Context graphs didn’t start as a strategy for us. They emerged as the only viable architecture once we tried to scale enterprise implementations with AI agents in the real world.
If the next generation of enterprise platforms is defined by captured reasoning rather than stored state, then context graphs won’t be optional infrastructure.
They’ll be unavoidable. And for us, they already are.
If this resonates and you’re dealing with similar implementation complexity, our team is always open to compare notes. Contact us.
Originally published on our Beacon.li LinkedIn page: https://www.linkedin.com/pulse/context-graphs-arent-theory-how-we-use-them-real-client-implementations-wjroc/
Recent Jaya Gupta 's writing on context graphs has surfaced an important question: where does real enterprise AI value actually come from?
The emerging answer is that it won’t come from layering AI on top of systems of record, but from capturing the decision context that connects data to action.
For us at Beacon, this wasn’t a thesis we set out to prove. Context graphs emerged as a by-product of running AI agents in production—first across workflows and support, and later across full enterprise implementations.
The moment we treated AI as part of the execution layer, not a SaaS copilot. The architecture became obvious: execution must produce memory, and memory must be contextual.
We didn’t start by building a “context graph platform.” We started by treating AI as part of the execution layer. Once you do that, a few things follow naturally:
Execution produces trajectories
Trajectories carry context
Systems only improve if that context is persisted and reused
Context graphs weren’t a product decision. They were the natural outcome of execution-first AI.
This post is a walkthrough of how that architecture emerged, and why it became unavoidable once we moved beyond bounded automation into real enterprise implementations.
The Failure Mode: Missing Context, Not Missing Steps
As we moved into full implementations, execution stopped being the problem. The bottleneck was context.
Critical decisions lived in Slack threads, calls, and escalations, then disappeared. Every implementation restarted from scratch.
At that point, automation wasn’t the constraint. Institutional memory was.
Implementations don’t fail because systems don’t know what exists, they fail because systems don’t know what mattered in a specific context.
The Architectural Shift: From State to Event Memory
This is where the “two clocks” distinction, introduced by Animesh Koratana of PlayerZero became unavoidable.
Enterprise systems are built around the state clock: > What is true right now?
Implementations run on the event clock: > What happened, in what order, and why?
Our orchestration system already had access to the event clock because agents were executing work in real time. The missing piece was persisting that event-level reasoning as a first-class artifact.
This is where context graphs entered the picture.
What a Context Graph Means in Beacon
In Beacon, a context graph is not:
A static DAG
A documentation layer
A manually curated ontology
It is a learned, evolving representation of execution context, constructed from agent trajectories.
Core primitives we persist:
Each implementation produces a trajectory of decisions and outcomes. Over time, these trajectories overlap and cluster.
Traditional enterprise systems record state.
For example: Auto-sync: Disabled
That tells you what’s true, not how you got there or why.
In Beacon, we capture:
What exists: auto-sync is disabled
What happened: the setting was changed during implementation
Why it happened: to resolve a data validation conflict caused by concurrent writes from a legacy system
That “why” usually lives in Slack threads or in someone’s head. Once the project ends, it’s lost.
In Beacon, that reasoning becomes system memory. Each decision is recorded as a trace linked to the configuration, data condition, implementation phase, and downstream outcome.
Across implementations, these traces repeat and connect. The structure isn’t predefined. It emerges from real execution.
That accumulated graph of decisions, context, and outcomes is what we call the context graph.
Context Graphs Across the Implementation Lifecycle
1. Configuration Phase
During configuration, agents don’t simply apply settings. They record:
Option selections
Dependency activations
Constraint violations
Manual overrides
These decisions become nodes and edges in the context graph:
Over time, the system learns which configuration subgraphs are stable and which are fragile.
2. UAT Phase
Most UAT failures aren’t new defects. They’re downstream effects of earlier decisions.
In Beacon, UAT works like this:
Agents generate UAT flows from the live configuration, data, and real workflow paths
When a test fails, it’s traced back to the configuration or sequencing decision that caused it
The system determines whether the behavior is expected under this implementation context
For example:
Payroll sync is intentionally disabled during migration
A payroll mismatch appears in UAT
The system recognizes this as an expected outcome, not a blocker
That result is recorded and linked to:
The original configuration override
The migration phase
Post–go-live outcomes
When a future HRMS implementation hits the same constraint,
It can surface:
In previous implementations, disabling payroll sync during migration avoided data corruption but caused predictable UAT payroll mismatches that resolved post–cutover.
This creates cross-phase edges in the context graph:
3. Hypercare Phase
Hypercare is where context graphs prove their value.
Post–go-live issues almost always trace back to earlier decisions. Our agents resolve a large percentage autonomously. But more importantly, record causal chains
This creates feedback loops:
Across implementations, this collapses hypercare duration dramatically. In practice, we’ve seen ~60% average reduction in end-to-end timelines, primarily because fewer unknowns reach production.
Why This Only Works with Agents in the Execution Path
Warehouses see data after the fact. CRMs see current state. Logs see events without meaning.
Context graphs require being in the execution path at commit time.
Our agents:
See inputs across systems
Evaluate conditions
Take actions
Observe outcomes
This is why the graph can encode why, not just what.
Industry Generalization Without Resetting
We’ve deployed this architecture across HRMS, Logistics, Insurtech, Retail and Enterprise SaaS
For example:
In a CRM implementation, an opportunity close date validation might fail because the fiscal calendar wasn’t configured before pipeline rules were activated.
In an HRMS implementation, payroll calculations might be blocked because benefits eligibility rules weren’t defined before employee data was imported.
The domains are different. The symptoms look unrelated. But the pattern is identical: a downstream failure caused by an earlier sequencing decision.
We don’t start from zero per industry. We start with accumulated execution intelligence.
What We’re Building Toward
The long-term value isn’t faster implementations alone.
It’s a system where:
Every implementation teaches the platform
Every exception becomes searchable precedent
Every decision strengthens future autonomy
Context graphs turn implementations from cost centers into compounding assets.
So when people ask whether context graphs are real, or whether enterprises are “ready” for them, our answer is straightforward: If you’re orchestrating real work with agents, you’ll be forced to build them. If you’re not, they’ll remain a thought experiment.
To be candid, some problems remain hard across the industry:
Partial observability of legacy systems
Identity resolution across tools
Causal inference vs correlation at scale
Human-legible explanations over dense graphs
Closing
Context graphs didn’t start as a strategy for us. They emerged as the only viable architecture once we tried to scale enterprise implementations with AI agents in the real world.
If the next generation of enterprise platforms is defined by captured reasoning rather than stored state, then context graphs won’t be optional infrastructure.
They’ll be unavoidable. And for us, they already are.
If this resonates and you’re dealing with similar implementation complexity, our team is always open to compare notes. Contact us.
Originally published on our Beacon.li LinkedIn page: https://www.linkedin.com/pulse/context-graphs-arent-theory-how-we-use-them-real-client-implementations-wjroc/